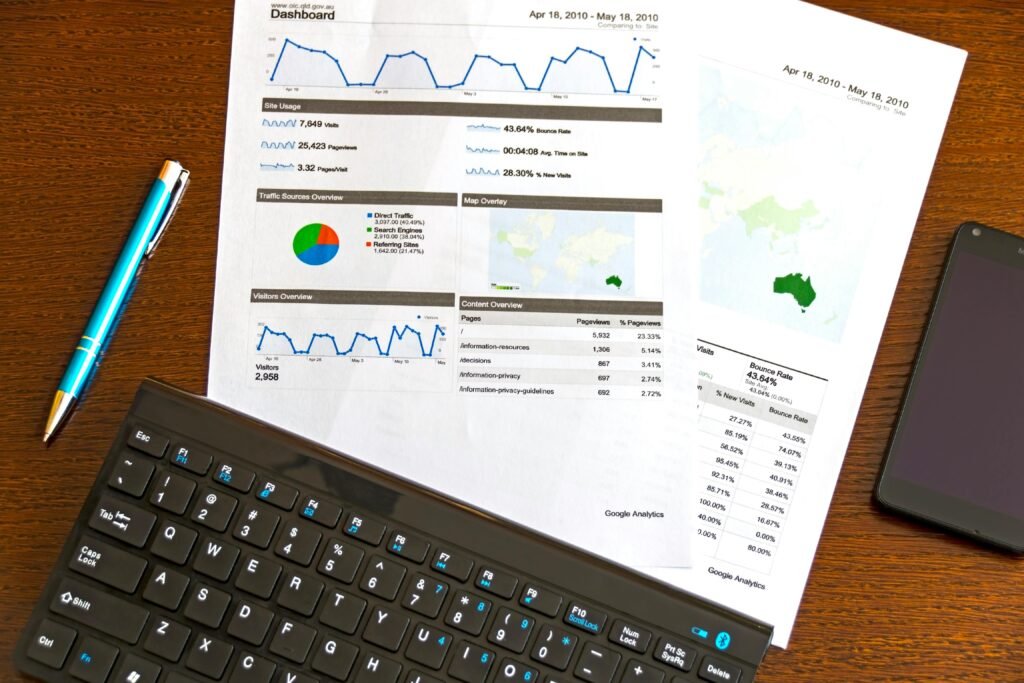
Salesforce Reporting and Dashboards: Making Data-Driven Decisions
Introduction to Salesforce Reporting & Dashboards:
Salesforce Reporting and Dashboards serve as the backbone of data analysis and decision-making processes for businesses worldwide. From sales performance tracking to customer service insights, these tools empower organizations to extract valuable information from their Salesforce data and drive strategic actions. In this article, we’ll explore the significance of Salesforce Reporting and Dashboards, their key features, best practices, and how businesses can leverage them effectively.

Understanding Salesforce Reporting:
Salesforce Reporting provides a powerful mechanism for analyzing data stored within the Salesforce platform. It allows users to create various types of reports, ranging from simple tabular reports to complex matrix reports and joined reports. These reports can be customized to display specific data fields, filtered based on criteria, and grouped to provide insights at different levels of granularity.
Types of Reports in Salesforce:
- Tabular Reports: Tabular reports present data in a simple table format, displaying records in rows and fields in columns. They are useful for displaying basic data without any summarization
- Summary Reports: Summary reports provide summarized views of data, grouped by specified fields. They include subtotals and can be further customized with charts to visualize trends and patterns.
- Matrix Reports: Matrix reports organize data into a grid format, with rows and columns grouped and summarized based on specified criteria. They are particularly useful for comparing data across multiple categories simultaneously.
- Joined Reports: Joined reports allow users to combine multiple report blocks into a single report, each block displaying data from different report types or data sources. This enables users to analyze related data sets side by side.
- Custom Reports: Custom reports are created by users to meet specific business requirements. Users can define the report format, select fields, and apply filters and grouping as needed.
Key Features of Salesforce Reporting:
- Customizable Report Types: Salesforce offers a range of pre-built report types tailored to different business needs, such as Leads, Opportunities, Cases, and Campaigns. Additionally, users can create custom report types to suit unique requirements.
- Filters and Conditions: Reports can be filtered based on specific criteria to focus on relevant data. Conditions can be applied to refine the data further, enabling users to extract precise insights.
- Grouping and Summarizing: Users can group data in reports based on fields such as date, category, or territory. Summarization features like subtotal rows, summary formulas, and charts provide a holistic view of the data.
- Report Exporting and Scheduling: Reports can be exported in various formats (e.g., Excel, PDF) for offline analysis or sharing with stakeholders. Moreover, scheduling options allow users to automate report generation and distribution at scheduled intervals.
Leveraging Salesforce Dashboards:
Salesforce Dashboards offer a visual representation of key metrics and performance indicators, providing at-a-glance insights into the health of various business processes.
Key Features of Salesforce Dashboards:
- Real-Time Data Visualization: Dashboards display real-time data from Salesforce reports, enabling users to monitor performance metrics and trends as they unfold.
- Dynamic Filtering: Users can interact with dashboards by applying filters to visualize data based on specific criteria. This interactivity enhances the flexibility and usability of dashboards.
- Drill-Down Capabilities: Dashboards support drill-down functionality, allowing users to explore underlying data in more detail by clicking on specific data points or elements within the dashboard components.
- Mobile Accessibility: Salesforce Dashboards are optimized for mobile devices, ensuring that users can access critical insights anytime, anywhere, from their smartphones or tablets.
Types of Dashboards in Salesforce:
- Standard Dashboards: Standard dashboards in Salesforce are created using standard components such as charts, tables, and metrics. They provide a basic but effective way to visualize key metrics and performance indicators.
- Dynamic Dashboards: Dynamic dashboards allow users to personalize their dashboard views by applying filters and customizing components based on their preferences. This enhances dashboard interactivity and flexibility.
- Operational Dashboards: Operational dashboards focus on providing real-time insights into operational metrics and KPIs, enabling users to monitor day-to-day activities and make immediate decisions.
- Analytical Dashboards: Analytical dashboards are designed for in-depth analysis and exploration of data trends and relationships. They typically include advanced visualization techniques and drill-down capabilities to uncover insights.
- Mobile Dashboards: Mobile dashboards are optimized for viewing on mobile devices, providing a responsive and user-friendly experience for accessing critical insights on the go.
Best Practices for Salesforce Reporting and Dashboards:
- Understand Business Requirements: Before creating reports and dashboards, it’s essential to understand the specific requirements and objectives of stakeholders. This ensures that the generated insights align with business goals.
- Keep it Simple and Relevant: Avoid cluttering reports and dashboards with unnecessary information. Focus on presenting the most relevant metrics and insights that drive actionable decisions.
- Maintain Data Accuracy: Regularly review and validate data sources to ensure accuracy and reliability.
- Foster User Adoption: Provide training and support to users to familiarize them with Salesforce Reporting and Dashboards. Encourage adoption by showcasing the value of data-driven decision-making.
Conclusion: Salesforce Reporting and Dashboards are indispensable tools for organizations seeking to harness the power of their Salesforce data. By leveraging these tools effectively, businesses can gain actionable insights, optimize processes, and drive growth. By following best practices and continually refining reporting strategies, organizations can unlock the full potential of Salesforce Reporting and Dashboards to stay ahead in today’s competitive landscape.
Ready to master Salesforce Reporting & Dashboards? Enroll now at almamate.in and elevate your data-driven decision-making skills!
**Disclaimer: The images featured in this article have been sourced from pexels.com for illustrative purposes.


